
Reduction of CO₂ Emissions
CO₂ emissions
Trend in CO₂ Emissions (Scope 1 + 2) Reduction Trend in Energy Consumption
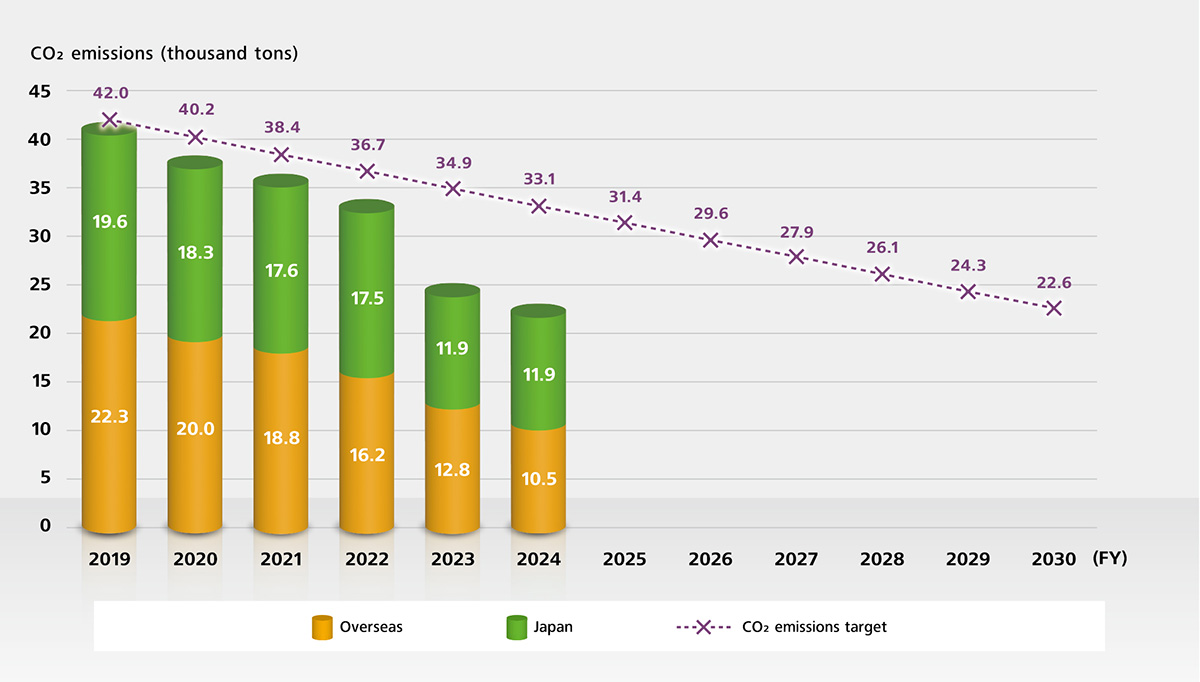
Total CO₂ emissions from the entire JVCKENWOOD Group (Scope 1 + 2) have been in a general downtrend since 2014. Currently, we are aiming to achieve our JK Green 2030 short-term/medium-term target of "46.2% reduction by FY2030 compared to FY2019," and our total CO₂ emissions in Japan and overseas in FY2024 were 22,454 tons (-46.5% compared to FY2019).
In addition, as a short-term target to achieve the goal, we aim to reduce CO₂ emissions by 25.2% in FY2025 compared to FY2019.
Measurement of emissions
CO₂ emissions target Scope 1 + 2 (FY2019-2030)
Unit: Thousand tons
| Base | Plan/Achievement | ||||||||||||
|---|---|---|---|---|---|---|---|---|---|---|---|---|---|
| 2019 | 2020 | 2021 | 2022 | 2023 | 2024 | 2025 | 2026 | 2027 | 2028 | 2029 | 2030 | ||
| CO2 emissions | Plan | 42.0 | 40.2 | 38.4 | 36.7 | 34.9 | 33.1 | 31.4 | 29.6 | 27.9 | 26.1 | 24.3 | 22.6 |
| Achievement | 42.0 | 38.3 | 36.4 | 33.7 | 24.7 | 22.5 | |||||||
| CO2 emission reduction rate Compared to FY2019 |
Plan | - | 4.2% | 8.4% | 12.6% | 16.8% | 21.0% | 25.2% | 29.4% | 33.6% | 37.8% | 42.0% | 46.2% |
| Achievement | - | 8.8% | 13.3% | 19.8% | 41.0% | 46.5% | |||||||
Coverage: The rate of reduction in CO₂ emissions is calculated based on actual data for 2020-2024 and target data for 2025-2030
Coverage: refer to “CO₂ emissions by business center”
Trend in CO₂ emissions (FY2019-2024)
Coverage: refer to “CO₂ emissions by business center”
CO₂ emissions (FY2020-2024)
Unit: Thousand tons
| FY2020 | FY2021 | FY2022 | FY2023 | FY2024 | ||
|---|---|---|---|---|---|---|
| Scope1★ | - | 1.1 | 1.2 | 1.4 | 1.1 | 0.7 |
| Scope2 | Market-based approach★ | 37.3 | 35.3 | 32.3 | 23.6 | 21.8 |
| Location-based approach | 37.6 | 35.3 | 31.4 | 24.6 | 21.4 | |
| Total | Market-based approach★ | 38.3 | 36.4 | 33.7 | 24.7 | 22.5 |
| Location-based approach | 38.7 | 36.4 | 32.7 | 25.7 | 22.1 |
2024 data for items marked with a star (★) has obtained third-party assurance. (For details, please see the section on Third-party assurance for environmental data.)
Note 1. Coverage includes domestic and some overseas consolidated subsidiaries. Refer to "CO2 emissions by business center."
Note 2. Scope1 emissions are calculated using the energy consumption of each facility and the emissions intensity published by the Ministry of the Environment, Japan.
Note 3. Domestic Scope2 emissions are calculated based on electricity consumption and the emission factors published by the respective institutions. Calculations with market standards and location standards are made using the latest factors provided by the Ministry of the Environment, Japan.
CO₂ emissions per unit of revenue (FY2020-2024)
1,000 tons/100 million yen
| FY2020 | FY2021 | FY2022 | FY2023 | FY2024 | |
|---|---|---|---|---|---|
| emissions per unit of sales | 0.0140 | 0.0129 | 0.0100 | 0.0069 | 0.0061 |
Greenhouse gas emissions other than CO₂ are as follows:
Greenhouse gas emissions other than CO₂ (FY2020-2024)
Unit: Thousand tons
| FY2020 | FY2021 | FY2022 | FY2023 | FY2024 | |
|---|---|---|---|---|---|
| Hydrofluorocarbon | 0.099 | 0.092 | 0.092 | 0.036 | 0.004 |
| Perfluorocarbon | 0.0 | 0.0 | 0.0 | 0.0 | 0.0 |
Coverage: refer to “CO₂ emissions by business center”
CO₂ emissions by business center (FY2020–2024)
Unit: Thousand tons
| Japan/Overseas | Company Name and location | 2020 | 2021 | 2022 | 2023 | 2024 |
|---|---|---|---|---|---|---|
| Fiscal year target | 40.2 | 38.4 | 36.7 | 34.9 | 33.1 | |
| Japan | Head Office & Yokohama Business Center | 2.9 | 2.7 | 2.0 | 1.1 | 1.7 |
| Hachioji Business Center | 1.6 | 1.5 | 1.7 | 1.2 | 0.5 | |
| Hakusan Business Center | 1.1 | 1.0 | 1.0 | 0.7 | 0.7 | |
| Kurihama Business Center | 3.3 | 3.2 | 2.6 | 1.6 | 0.1 | |
| Niigata Device Production Section | - | - | - | - | 1.1 | |
| Yokosuka Business Center | 0.4 | 0.4 | 0.5 | 0.4 | 0.5 | |
| Shinagawa Office | - | - | - | 0.4 | 0.5 | |
| JVCKENWOOD Yamagata | 0.5 | 0.4 | 0.7 | 0.4 | 0.4 | |
| JVCKENWOOD Nagano | 0.9 | 1.0 | 1.1 | 1.1 | 1.0 | |
| JVCKENWOOD Nagaoka | 1.2 | 1.1 | 1.4 | 0.9 | 1.1 | |
| JVCKENWOOD Creative Media | 5.5 | 5.3 | 5.4 | 3.5 | 3.5 | |
| Victor Entertainment | 0.8 | 0.8 | 0.8 | 0.5 | 0.6 | |
| JVCKENWOOD Video Tech | 0.1 | 0.1 | 0.1 | 0.1 | 0.1 | |
| JVCKENWOOD Design | 0.0 | 0.0 | 0.0 | 0.0 | 0.0 | |
| Malaysia | JVCKENWOOD Electronics Malaysia Sdn. Bhd. | 2.9 | 2.9 | 3.3 | 3.5 | 3.4 |
| Thailand | JVCKENWOOD Electronics (Thailand) Co., Ltd. | 1.1 | 1.3 | - | - | - |
| JVCKENWOOD Optical Electronics (Thailand) Co., Ltd. | 2.2 | 1.9 | 2.0 | 1.9 | 1.5 | |
| Indonesia | PT JVCKENWOOD Electronics Indonesia | 8.1 | 7.7 | 7.1 | 5.8 | 5.6 |
| People’s Republic of China | Shanghai Kenwood Electronics Co., Ltd. | 5.1 | 4.4 | 3.4 | 1.6 | - |
| Singapore | JVCKENWOOD Technologies Singapore Pte. Ltd. | 0.6 | 0.6 | 0.4 | - | - |
| Overall total | 38.3 | 36.4 | 33.7 | 24.7 | 22.5 | |
Coverage: The fiscal targets for FY2019 and beyond were revised with the start of the new environmental plan.
CO₂ Emissions (Scope 3)
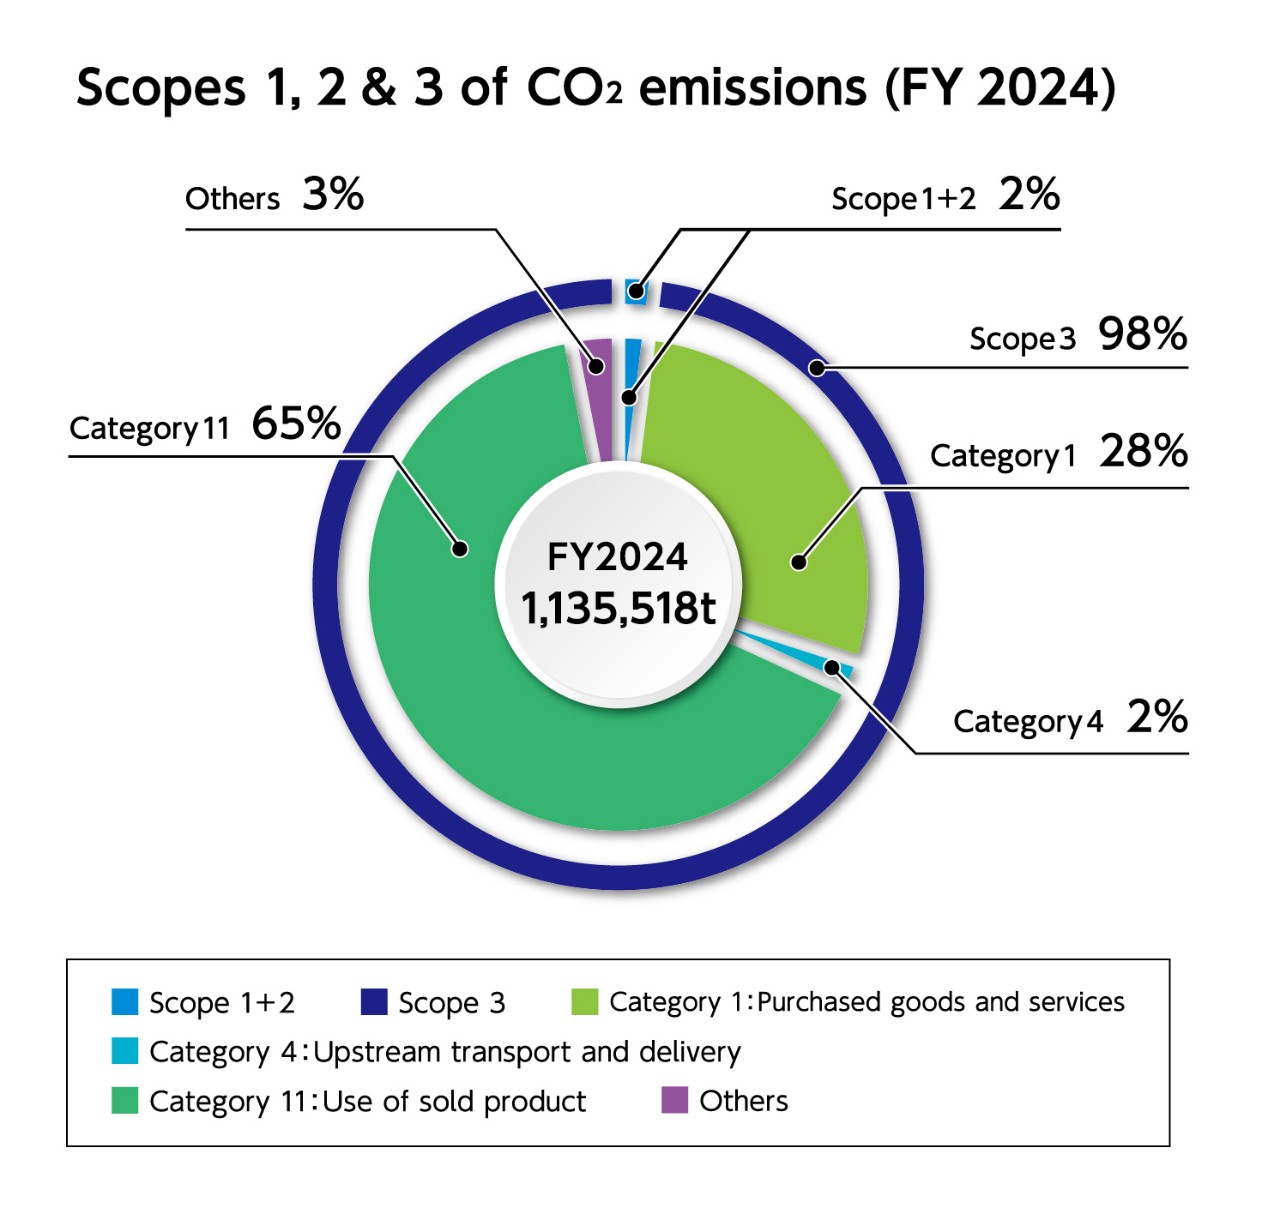
We calculate indirect CO₂ emissions from various processes of our corporate activities, from raw material procurement to manufacturing, transportation, use and disposal. Actual emissions are calculated based on ”the Basic Guidelines on Accounting for Greenhouse Gas Emissions Throughout the Supply Chain” published by the Ministry of the Environment and the Ministry of Economy, Trade and Industry. Going forward, we will continue working to cut CO₂ emissions by reducing the number of parts per product and developing power-saving products through the use of life cycle assessment.
CO₂ emissions in Scope 3 (FY2024) Calculation period: from April 2024 to March 2025
| Category | Calculation results (Thousand tons CO2e) |
Calculation summary | |
|---|---|---|---|
| FY2024 | |||
| 1 | ★Purchased goods and services | 321.2 | Emissions associated with raw materials, parts, and purchased products |
| 2 | Capital goods | 28.6 | Emissions generated by the capital investment |
| 3 | Fuel- and energy-related activities not included in Scope 1 and 2 | 3.5 | Emissions associated with energy procurement |
| 4 | ★Upstream transportation and distribution | 17.5 | Emissions associated with transportation of raw materials and products |
| 5 | Waste generated during operations | 1.0 | Emissions associated with waste from business activities |
| 6 | Business travel | 0.9 | Emissions associated with employees’ business travel |
| 7 | Employee commuting | 1.6 | Emissions associated with employees’ commuting |
| 8 | Upstream leased assets | — | (Not calculated) |
| 9 | Downstream transportation and distribution | — | (Not calculated) |
| 10 | Processing of sold products | — | (Not calculated) |
| 11 | Use of sold products | 736.9 | Emissions associated with expected electric power consumption from products sold |
| 12 | End-of-life treatment of sold products | 1.9 | Emissions associated with anticipated disposal of products sold |
| 13 | Downstream leased assets | — | (Not calculated) |
| 14 | Franchises | — | (Not calculated) |
| 15 | Investments | — | (Not calculated) |
| Overall total | 1113.1 | ||
2024 data for items marked with a star (★) has obtained third-party assurance. (For details, please see the section on Third-party assurance for environmental data.)
Note: Additional items for Scope3 emissions calculations are as follows.
- Category 1: Primary data obtained from suppliers was prioritized for usage.
- Category 4: Ocean and air freight emissions were calculated on a "Well to Wheel" basis. Well to Wheel is an indicator which evaluates energy efficiency and environmental burden across all stages, from extraction (such as from wells), refining, and transporting the energy (such as oil or electricity) used through to when vehicles actually travel (the wheels are turned).
- Category 11: Recalculation was carried out from the base year of 2019 due to active expansion and significant growth in the relevant businesses (products).
Coverage: All group companies in Japan and certain overseas companies
Scope 3 CO2 emissions by category (FY2019-2024)
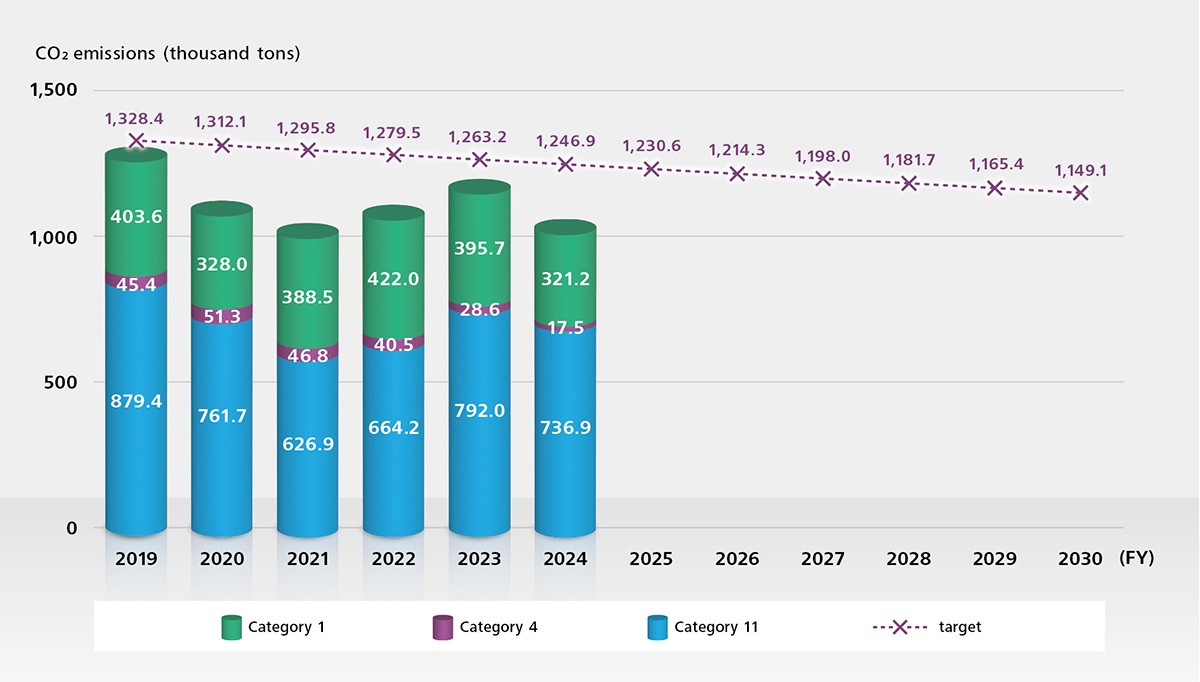
Coverage: All group companies in Japan and certain overseas companies
Efforts to Reduce CO₂ Emissions
Measures to Adapt to Climate Change
We identify natural disaster risks in the risk surveillance process described in "Disclosure based on TCFD recommendations." For identified risks, we take approaches to raise awareness of disaster prevention among officers and employees on a regular basis by developing various manuals describing the responses to possible crises, as well as implementing emergency drills, business continuity plans (BCPs) and safety confirmation drills in the event of an emergency.
With respect to natural disasters, six global affiliated manufacturing companies located in China and South East Asia where flooding occurs frequently, we have identified risks of facility damage and shutdown due to a flood or other disaster in these regions. In response to these risks, considering the avoidance of procurement suspension risk, as well as development backup, we have implemented countermeasures such as production in several regions, purchase from several suppliers, and supply chain procurement and transportation of parts and products from low-risk countries and regions. We also hold stocks in accordance with our BCP and secure stocks by using brokers to prevent a sudden cost increase and the suspension of manufacturing activities at the domestic and overseas production plants of the Group.
Initiatives to Save Energy
Reduction Trend in Energy Consumption
The JVCKENWOOD Group recognizes that it is responsible as a manufacturer for reducing the use of limited resources and energy as much as it can and realizing a sustainable production process. Therefore, we work to monitor and reduce energy consumption especially at production bases and make global efforts, such as reducing person-hours and installing energy-saving equipment. In FY2024, the JVCKENWOOD Group (all domestic and certain overseas companies) consumed 480.6 thousand GJ of energy. We will also continue our active efforts, including using alternative renewable energy sources, to achieve the mid- to long- term target.
Energy consumption (FY2019-2024)
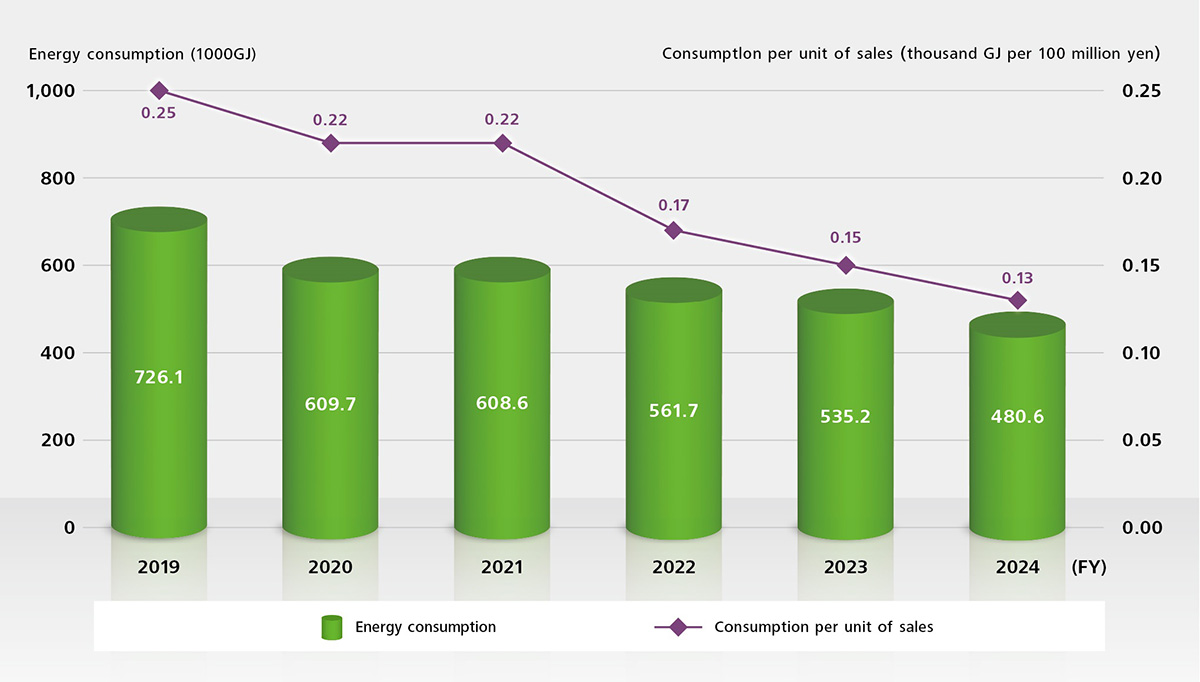
Coverage: All Group companies in Japan and certain overseas companies
Energy consumption by type (FY2020–FY2024)
| Energy type | FY2020 | FY2021 | FY2022 | FY2023 | FY2024 |
|---|---|---|---|---|---|
| Consumption of non-renewable fuel City gas (unit: thousand m3) | 341.2 | 348.7 | 238.4 | 196.0 | 5.7 |
| Consumption of non-renewable fuel LPG (unit: thousand kg) | 18.1 | 15.4 | 14.0 | 12.7 | 7.4 |
| Consumption of non-renewable fuel Gasoline (unit: kl) | 2.6 | 3.2 | 295.0 | 278.4 | 272.8 |
| Consumption of non-renewable fuel Heavy oil (unit: kl) | 31.7 | 47.4 | 3.3 | 3.1 | 1.6 |
| Consumption of non-renewable fuel Kerosene (unit: kl) | 60.0 | 74.5 | 48.0 | 0.0 | 8.0 |
| Consumption of non-renewable fuel Light oil (unit: kl) | 7.3 | 6.7 | 0.1 | 0.2 | 1.6 |
| Non-renewable electric power purchased (unit: thousand Kwh) | 63,109.4 | 62,852.0 | 57,594.4 | 45,128.0 | 40,618.3 |
| Non-renewable energy (steam, thermal, cooling, other) purchased | 0.0 | 0.0 | 0.0 | 0.0 | 7,084 |
| Purchase amount of electricity generated from renewable energy (thousand kWh) | 0.0 | 0.0 | 0.0 | 6,744.6 | 5,865.5 |
| Renewable energy (wind, solar, biomass, hydro, geothermal, etc.) generated (unit: thousand kwh) | 12.0 | 12.0 | 10.0 | 12.0 | 12.0 |
| Non-renewable energy (electric power, thermal/cooling power) sold | 0.0 | 0.0 | 0.0 | 0.0 | 0.0 |
| Total energy consumption cost | - | - | - | - | - |
2024 has obtained third-party assurance. (For details, please see the section on Third-party assurance for environmental data.)
Coverage 1: All group companies in Japan and certain overseas companies
Coverage 2: FY2022 emission inventory review
Utilization of Renewable Energy
As part of its climate change initiative, the Head Office and Yokohama Business Center are working to promote the use of renewable energy. Their two renewable energy generation systems produce 12,000 kwh of electricity per year. Electricity generated by the solar power system on the roof of the guard station is provided to the guard station, while electricity generated by the hybrid wind and solar power system near the gate is used for outdoor lights within the Head Office.
We are also installing solar panels on factories and warehouses of our Group companies to reduce CO2 emissions.

Solar panels on the guard station

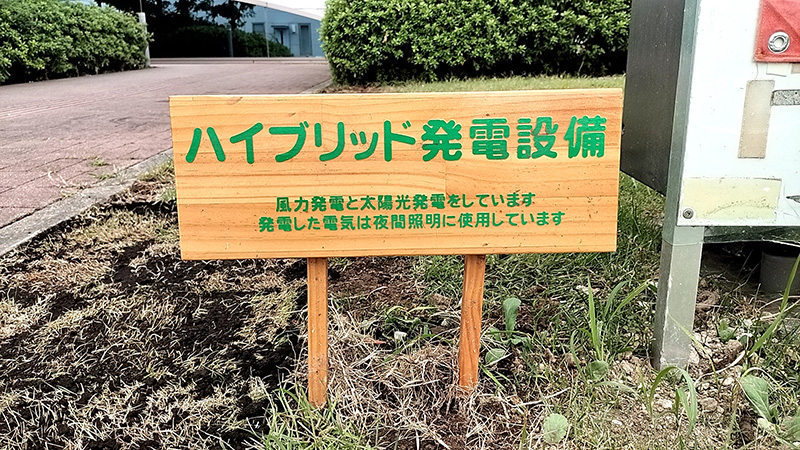
Hybrid wind and solar power system at gate
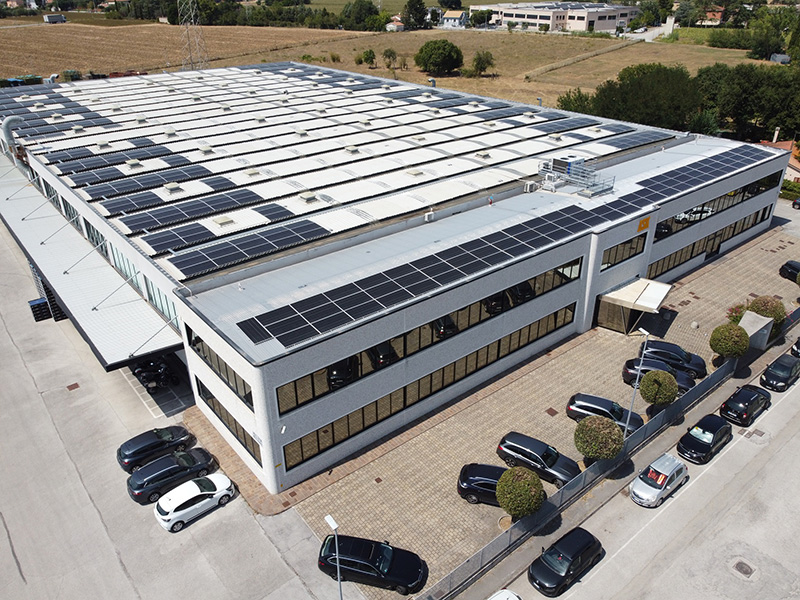
ASK Industries S.p.A. (Italy), Monte San Vito Factory
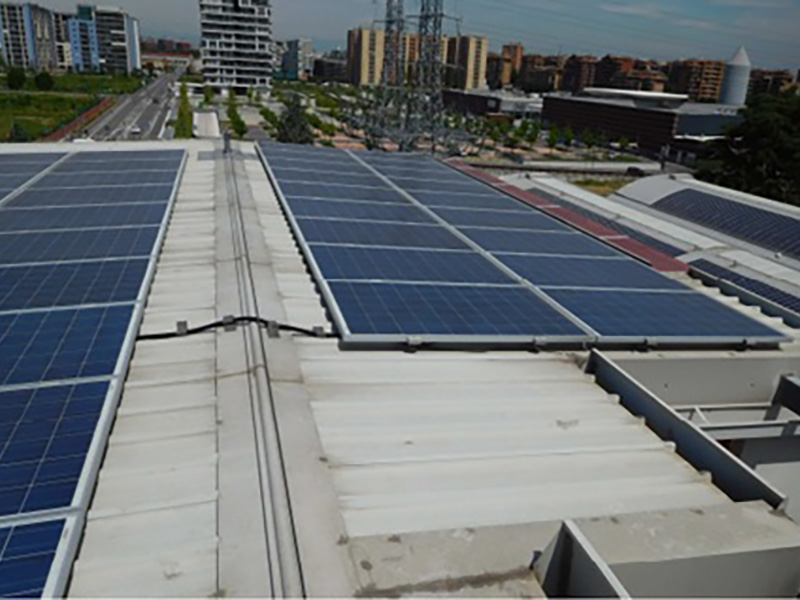
Radio Activity S.r.l. (Italy), warehouse roof
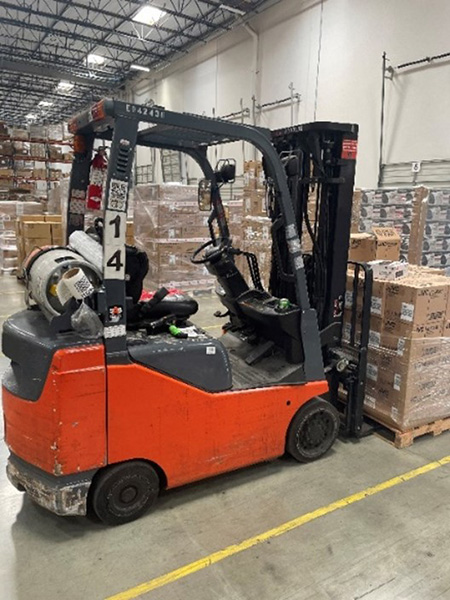
Changing to EV Forklifts (U.S.)
JVCKENWOOD USA Corporation is promoting a shift to EVs for forklifts used in warehouses. This company uses propane forklifts, which are fueled by propane. They are relatively clean compared with gasoline and diesel vehicles, and are even compliant with strict emissions regulations in California, but it has switched 21 out of 30 forklifts to EV forklifts, out of consideration for the environment and the health of employees. This company will continue promoting the switch to EVs.
Propane forklift

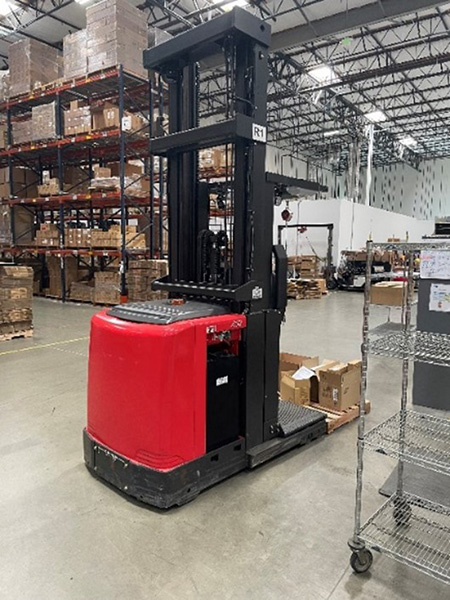
EV forklift
Initiatives in Design (Utilization of Life Cycle Assessment)
JVCKENWOOD practices Life Cycle Assessment * (LCA) as necessary in the product planning and design stages to identify and reduce environmental load throughout the lifecycle of the product. In the design process of new products and improvements to existing products, life cycle assessments are conducted in the technological divisions to analyze and grasp the CO₂ emissions throughout the entire life cycle, including production, transportation, use, recycling, and disposal. The results are managed in the databases of the product environment divisions. The results of the analysis are reported and reviewed by the relevant internal departments, and are reflected in the next year's environment-friendly design and product planning. This is tied to initiatives to reduce power consumption during product standby and use, reduce transportation energy by shrinking the volume and size of products and packaging materials, use recycled materials or biodegradable plastics for materials, and improve the replaceability and lifespan of consumable parts.
* Life Cycle Assessment (LCA): Quantitative evaluation of the environmental load throughout the lifecycle or at specific stages in the lifecycle (resource extraction, raw material production, product manufacturing, distribution, consumption, disposal, and recycling) of a product or service.
Sustainability Linked Loan
In September 2022, we concluded a loan agreement for a Sustainability Linked Loan (SLL) with a Sustainability Performance Target (SPT) based on the Group's reduction rate of CO2 emissions (Scope 1 + 2) and raised funds. The SLL loan aims to promote environmentally and socially sustainable economic activities and economic growth by setting SPTs based on the borrower's sustainability strategy and linking loan terms to the achievement of the SPTs, thereby motivating the borrower to achieve the targets.
In this loan, based on material issues, we aim to reduce the Group's CO2 emissions (Scope 1+2) by 25.2% by 2025 (compared to 2019). In 2025, Japan Credit Rating Agency, Ltd. (JCR), a third party, verified the progress of SPT reporting under its limited assurance procedure (JCR's independently established procedures in accordance with the relevant general principles, professional standards and "International standard for assurance engagements, other than audit or reviews of historical financial information (ISAE 3000)" for independent audits), and confirmed that the CO2 emission reduction rate for FY2024 had reached the target. In this verification procedure, we submitted aggregate data on CO2 emissions (Scope 1 + Scope 2) based on the Group's FY2024 energy consumption data (13 domestic and 3 overseas sites) as evidence of the progress of the SPT.
For more details, please refer to Sustainable Linked Loan Financing and Third-party limited assurance report (Japanese Only) .
Third-party Assurance for Environmental Data
In order to ensure the credibility of reports and continuously improve our environmental management, the JVCKENWOOD Group has obtained third-party assurances for environmental data. At our request, SOCOTEC Certification Japan Co., Ltd. provided third-party assurance services for FY2024 data, based on procedures that included on-site inspections of manufacturing sites.
Target data
- Scope1 GHG emissions
- Scope2 GHG emissions(Market-based approach)
- Scope3 GHG emissions(Category1,4)
- Energy consumption
Support for “COOL CHOICE” Campaign
In October 2020, the government of Japan issued a declaration that it would achieve carbon neutrality by 2050, and in April 2021 announced a goal of reducing greenhouse gas emissions by 46% over 2013 levels, with the potential to go as high as 50%. As part of its strategy to achieve this, the government launched the "COOL CHOICE" campaign to encourage people to make smart choices that help combat global warming when they replace products, use services and choose lifestyles. JVCKENWOOD announced its support for "COOL CHOICE" as part of efforts to contribute to SDGs Goal 13 (climate action).

Coverage: refer to “CO₂ emissions by business center”